Hello Citizens!
As you know, we voted on Tuesday. Yay, democracy!
By now you’ve probably had the chance to digest some of the the overall results. Citywide, Mayor Ed Lee coasted to victory with 57% of the vote, but that was an underwhelming tally given that he had no major opposition. The progressive hot-button ballot measures, Prop F (the Short Term Rental Ordinance) and Prop I (the Mission District Housing Moratorium) were both soundly defeated. Ross Mirkarimi, the scandal-tainted Sheriff, suffered a big (and appropriately humiliating) defeat. Prop A (the Affordable Housing Bond), Prop C (the Lobbyist Expenditure Ordinance), and Prop D (Mission Rock Development) were all approved by comfortable margins.
All politics is superhyperlocal, however, so what was the tally like for voters from Bernal Heights? And for different parts of Bernal Heights? Just as he did last year, Neighbor Adam has done us a great service by analyzing the election data from Bernal Heights to reveal how Bernal residents voted in 2015. Take it away, neighbor Adam:
Here’s a hyperlocal look at this week’s election, to follow up on the discussion that took place on Bernalwood last year about where Bernal voters fit in with the rest of the city and what, if any, differences there are between North and South Bernal.
This year, I analyzed Bernal’s vote using the election results data available at midday on November 3, 2015. This data may omit some subsequent vote counts that include late mail-in ballots, but the final results are unlikely to change significantly.
For 2015, I looked most closely three races: Mayor, Prop F (Short-Term Rentals), and Prop I (Mission Moratorium). These races probably reveal the greatest distinction in right-center-left or moderate-progressive voting patterns, and they serve as good follow-ups to last year’s Chiu/Campos race and Proposition B (waterfront development regulations).
Overall, the results clearly reflect Bernal’s left-leaning nature, with Mayor Lee failing to get a majority in either North or South Bernal, and Props F and I both receiving greater percentages of “yes” votes here than they did citywide.
Interestingly, however, the differences between North and South Bernal are more pronounced this year, with North Bernal skewing farther left than South Bernal. For example, while both Prop I and Prop F captured a majority in North Bernal (by modest margins), both were defeated in South Bernal (also by modest margins).
This is somewhat surprising. Last year’s results didn’t show as much of a difference between North and South Bernal, and based on what I think is a slightly more attractive real estate market in North Bernal, one might have expected North Bernal to head in a more centrist direction after another year of resident turnover. But in fact, the opposite happened. Perhaps the real estate market had no effect on voting patterns, (Editor’s Note: Most likely, since the total number of houses that turn over in a given year is small.) or perhaps folks moving in to North Bernal are more progressive than those moving into South Bernal. Or perhaps these numbers are all too small to draw conclusions. What is certain is that Bernal has retained its status as a very left-leaning part of the city.
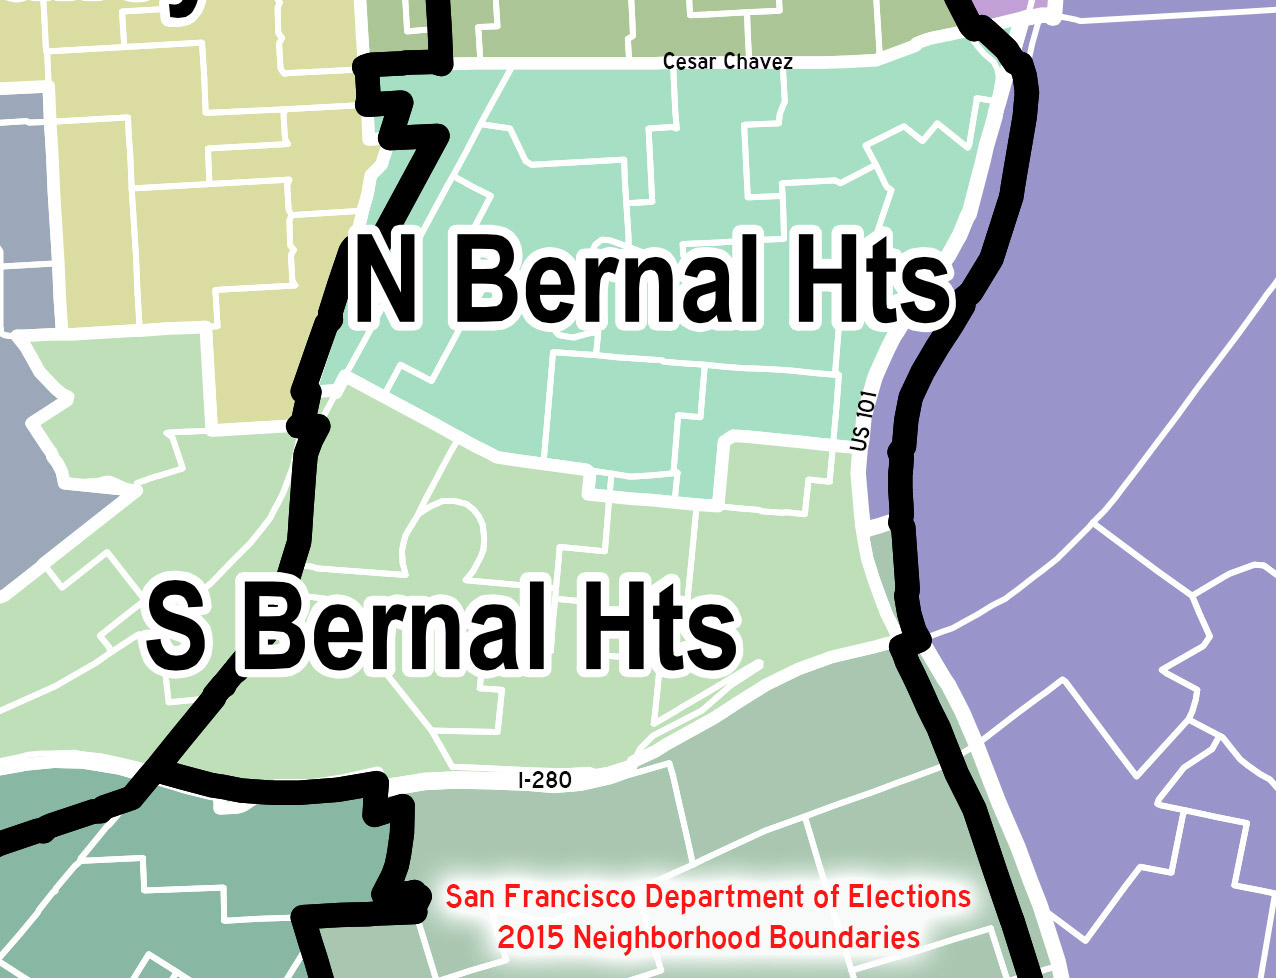
The difference in the result between North and South Bernal prompted Todd to wonder how the Dep’t of Elections defines the two voting districts. As you can see in the Election Departmment map shown above, North Bernal includes the more left-leaning microhoods in west Bernal and around the summit of Bernal Hill, while South Bernal includes the more centrist St. Mary’s microhood, along with some of our ancestral kin from the Bernal Glen area on the other side of the Bernal Cut.
For the sake of completeness, I’ve also included the results of the Sheriff’s race and all the other propositions. In general, they all show the same slight lean to the left in North Bernal, but are otherwise not quite as illuminating as the big three races of Mayor, Prop F, and Prop I.
Voter Turnout:
North Bernal: 2909/8208 = 35.44% of registered voters
South Bernal: 2211/7148 = 30.93% of registered voters
NOTE: these numbers above don’t match up to the vote totals below; not sure why. As such, percentages listed below are percentages of vote totals for each ballot item, not percentage of “turnout totals” above.
Mayor:
Citywide: LEE (57%)
North Bernal: LEE: 1156 (37.4%) OTHER: 1770 (57.3%)
South Bernal: LEE: 1021 (43.1%) OTHER: 1224 (51.7%)
Prop F – (Short Term Rental Ordinance)
Citywide: NO (55%)
North Bernal: YES – 1605 (50%) NO – 1577 (49%)
South Bernal: YES 1115 (46%) NO – 1288 (53%)
Prop I (Mission District Housing Moratorium)
Citywide: NO (57%)
North Bernal: YES – 1670 (52%) NO – 1472 (46%)
South Bernal: YES – 1171 (48%) NO- 1189 (49%)
Sheriff:
Citywide: Hennessy (61%)
North Bernal: Hennessy – 1554 (50.3%); Robinson – 109 (3.5%); Mirkarimi – 1205 (39%)
South Bernal: Hennessy – 1258 (53%); Robinson – 117 (4.9%); Mirkarimi – 1148 822 (35.7%)
And here are the rest of the 2015 ballot propositions:
Prop A (Affordable Housing Bond)
Citywide: YES (73.5%)
North Bernal: YES – 2512 (83%) NO – 481 (15.9%)
South Bernal: YES – 1784 (78.2%) NO – 464 (20.3%)
Prop B (Paid Parental Leave for City Workers)
Citywide: YES (66%)
North Bernal: YES – 2393 (79%) NO – 566 (18.7%)
South Bernal: YES – 1677 (73.5%) NO – 555 (24.3%)
Prop C (Lobbyist Expenditure Ordinance)
Citywide: YES (75%)
North Bernal: YES – 2178 (72%) NO – 715 (23.6%)
South Bernal: YES – 1614 (70.8%) NO – 556 (24.4%)
Prop D (Mission Rock Development)
Citywide: YES (73%)
North Bernal: YES – 2287 (75.6%) NO – 677 (22.4%)
South Bernal: YES – 1623 (71%); NO – 606 (26.6%)
Prop E (New Public Meeting Requirements)
Citywide: NO (67%)
North Bernal: YES – 782 (25.8%) NO – 2140 (70.7%)
South Bernal: YES – 635 (27.8%) NO – 1556 (68.2%)
Prop G (Renewable Energy Disclosures)
Citywide: NO (77%)
North Bernal: YES – 437 (14.4%) NO – 2424 (80.1%)
South Bernal: YES – 400 (17.5%) NO – 1729 (75.8%)
Prop H (Clean Energy Right to Know Act)
Citywide: YES (79.5%)
North Bernal: YES – 2477 (81.9%) NO – 359 (11.9%)
South Bernal: YES – 1793 (78.6%) NO – 325 (14.2%)
Prop J (Legacy Business Historic Preservation Fund)
Citywide: YES (57%)
North Bernal: YES – 1892 (62.5%) NO – 1027 (33.9%)
South Bernal: YES – 1367 (59.9%) NO – 812 (35.6%)
Prop K (Housing Development on Surplus City Land)
Citywide: YES (73%)
North Bernal: YES – 2458 (81.2%) NO – 475 (15.7%)
South Bernal: YES – 1733 (76%) NO – 462 (20.3%)
Wow! That’s fantastic. Thank you, Neighbor Adam, for crunching the data.
One final (and fascinating) detail: Despite all the bluster and noise, Prop F and Prop I didn’t do so well in the Mission either. For comparison’s sake, in the Mission, Prop F garnered just 55% of the vote, while Prop I — The Mission Moratorium! — squeaked by with just 56%. That puts Prop I in Ed Lee territory, which is to say that with those levels of support on their own home turf, the NIMBYs of the Mission don’t enjoy much of a mandate either.