It should come as a surprise to exactly no one that Bernal Heights is a rather left-liberal place, politically. But exactly how far left? And where are the mostest leftest enclaves within our domain?
Last year, we got some snapshot data on this courtesy of Neighbor Patrick, who pulled together a geektastic analysis of results from last November’s general election, breaking down the vote along the lines of Bernalwood’s Official Guide to Bernal Heights microhoods.
His conclusion, based on one election result, was: Voters from Foggy Vista on the west slope are the most progressive-left Bernalese, while the residents of St. Mary’s Park in the southwest are the most centrist.
Interestingly, a new citywide analysis by political consultant David Latterman seems to affirm that, while also providing more granular texture about the political leanings of Bernal’s other microhoods.
Scott Lucas from San Francisco Magazine kindly wrote up a summary of Latterman’s analysis (so I don’t have to):
Latterman, who works for moderate candidates and office holders, used methods developed by SF State professor Rich DeLeon, the author of Left Coast City and the most-widely respected authority on the history of San Francisco’s progressivism. (Point being: Their biases cancel out.)
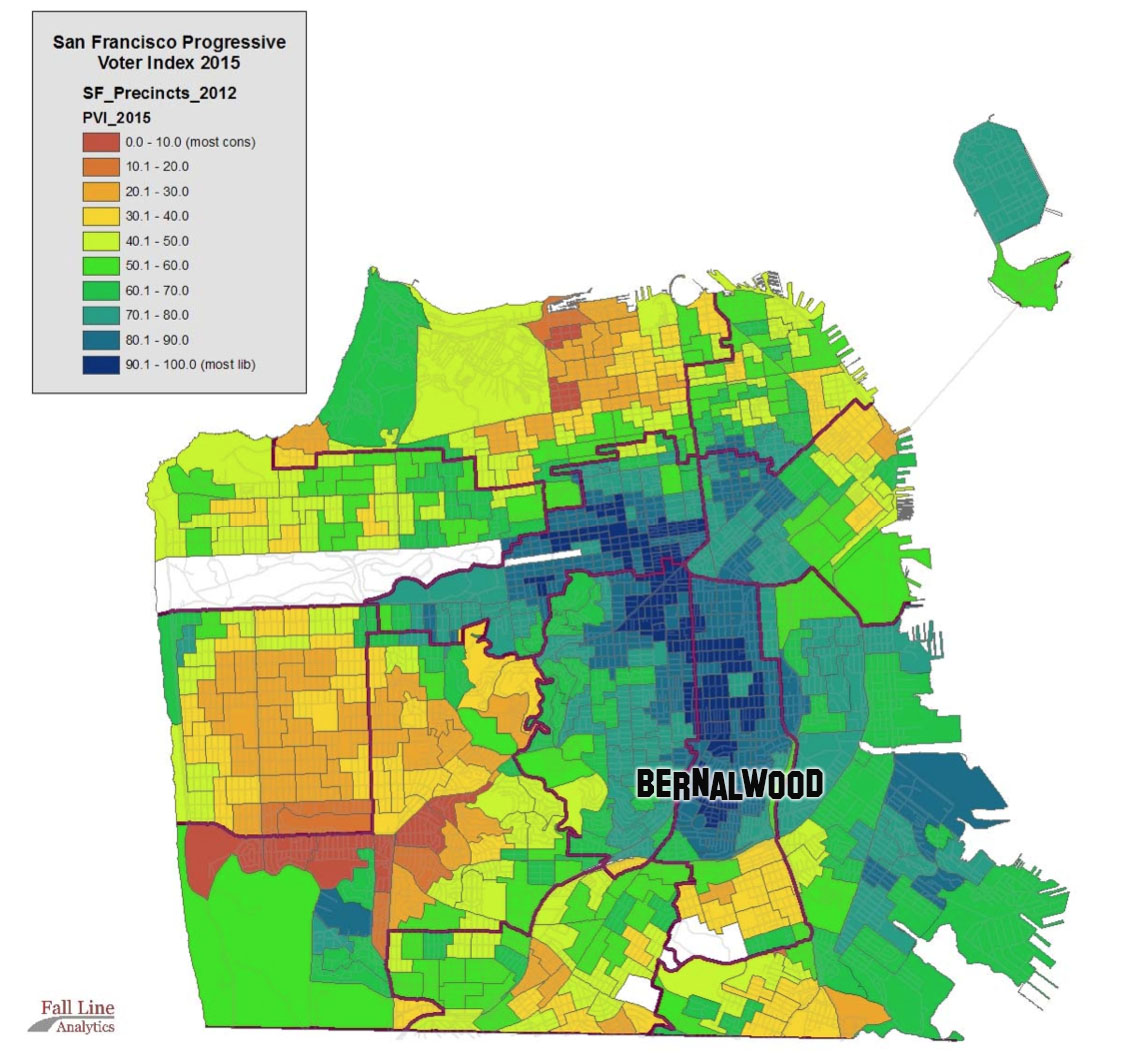
Using data on the voting outcomes at the precinct level for fourteen different ballot initiatives from 2012 to 2014, Latterman found that the distribution of left and further left voters in the city has remained constant since De Leon ran the numbers in 2004. The city’s progressives are concentrated in the center, in neighborhoods like the Tenderloin, the Mission, the Haight, and Bernal Heights. Less liberal voters, by contrast, ring around them, with the Sunset District and the Marina being home to the most conservative voters on local issues. That’s not news.
What is, however, is that Latterman has found evidence that voters who have moved to the city more recently are voting more conservatively than their neighbors: “Newer residents in San Francisco, especially in District 6 [SOMA], vote more conservatively than the longer‐residence voters around them. While this has been noted anecdotally and in some ballot measure results, this is some of the first strong quantitative evidence for this trend.”
Bernalwood used a zoom and enhance algorithm on one of Latterman’s infographics to generate a snapshot of Bernal’s political leanings, on a microhood basis. Here’s a closeup of Bernal Heights, and remember: the darker the blue, the more left-progressive the area is:
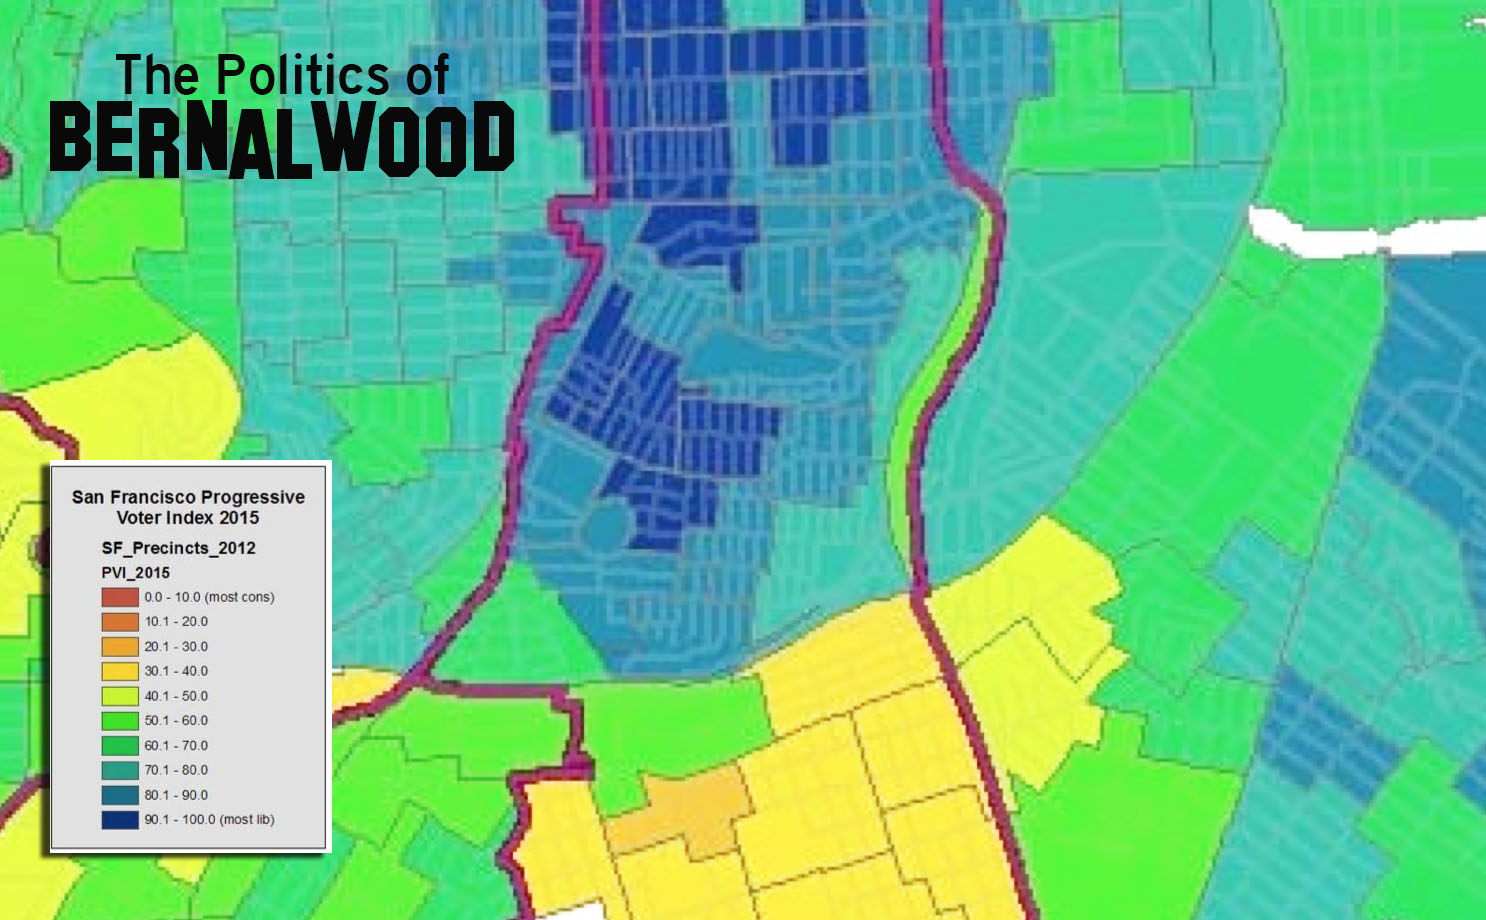
The patterns here are pretty clear. Indeed, as previously hypothesized, Foggy Vista on the west slope is highly progressive. Other progressive bastions include Cortlandia, Baja Cortlandia, and the western half of Precitaville. Indeed, citywide, Park Street would seem to be the southernmost frontier of San Francisco progressivism. Meanwhile, eastern Bernalese are more left-center, while the peoples of St. Mary’s are clearly in the middle of the political spectrum.
So now we know… with a bit more analytical certainty.
INFOGRAPHICS: Fall Line Analytics