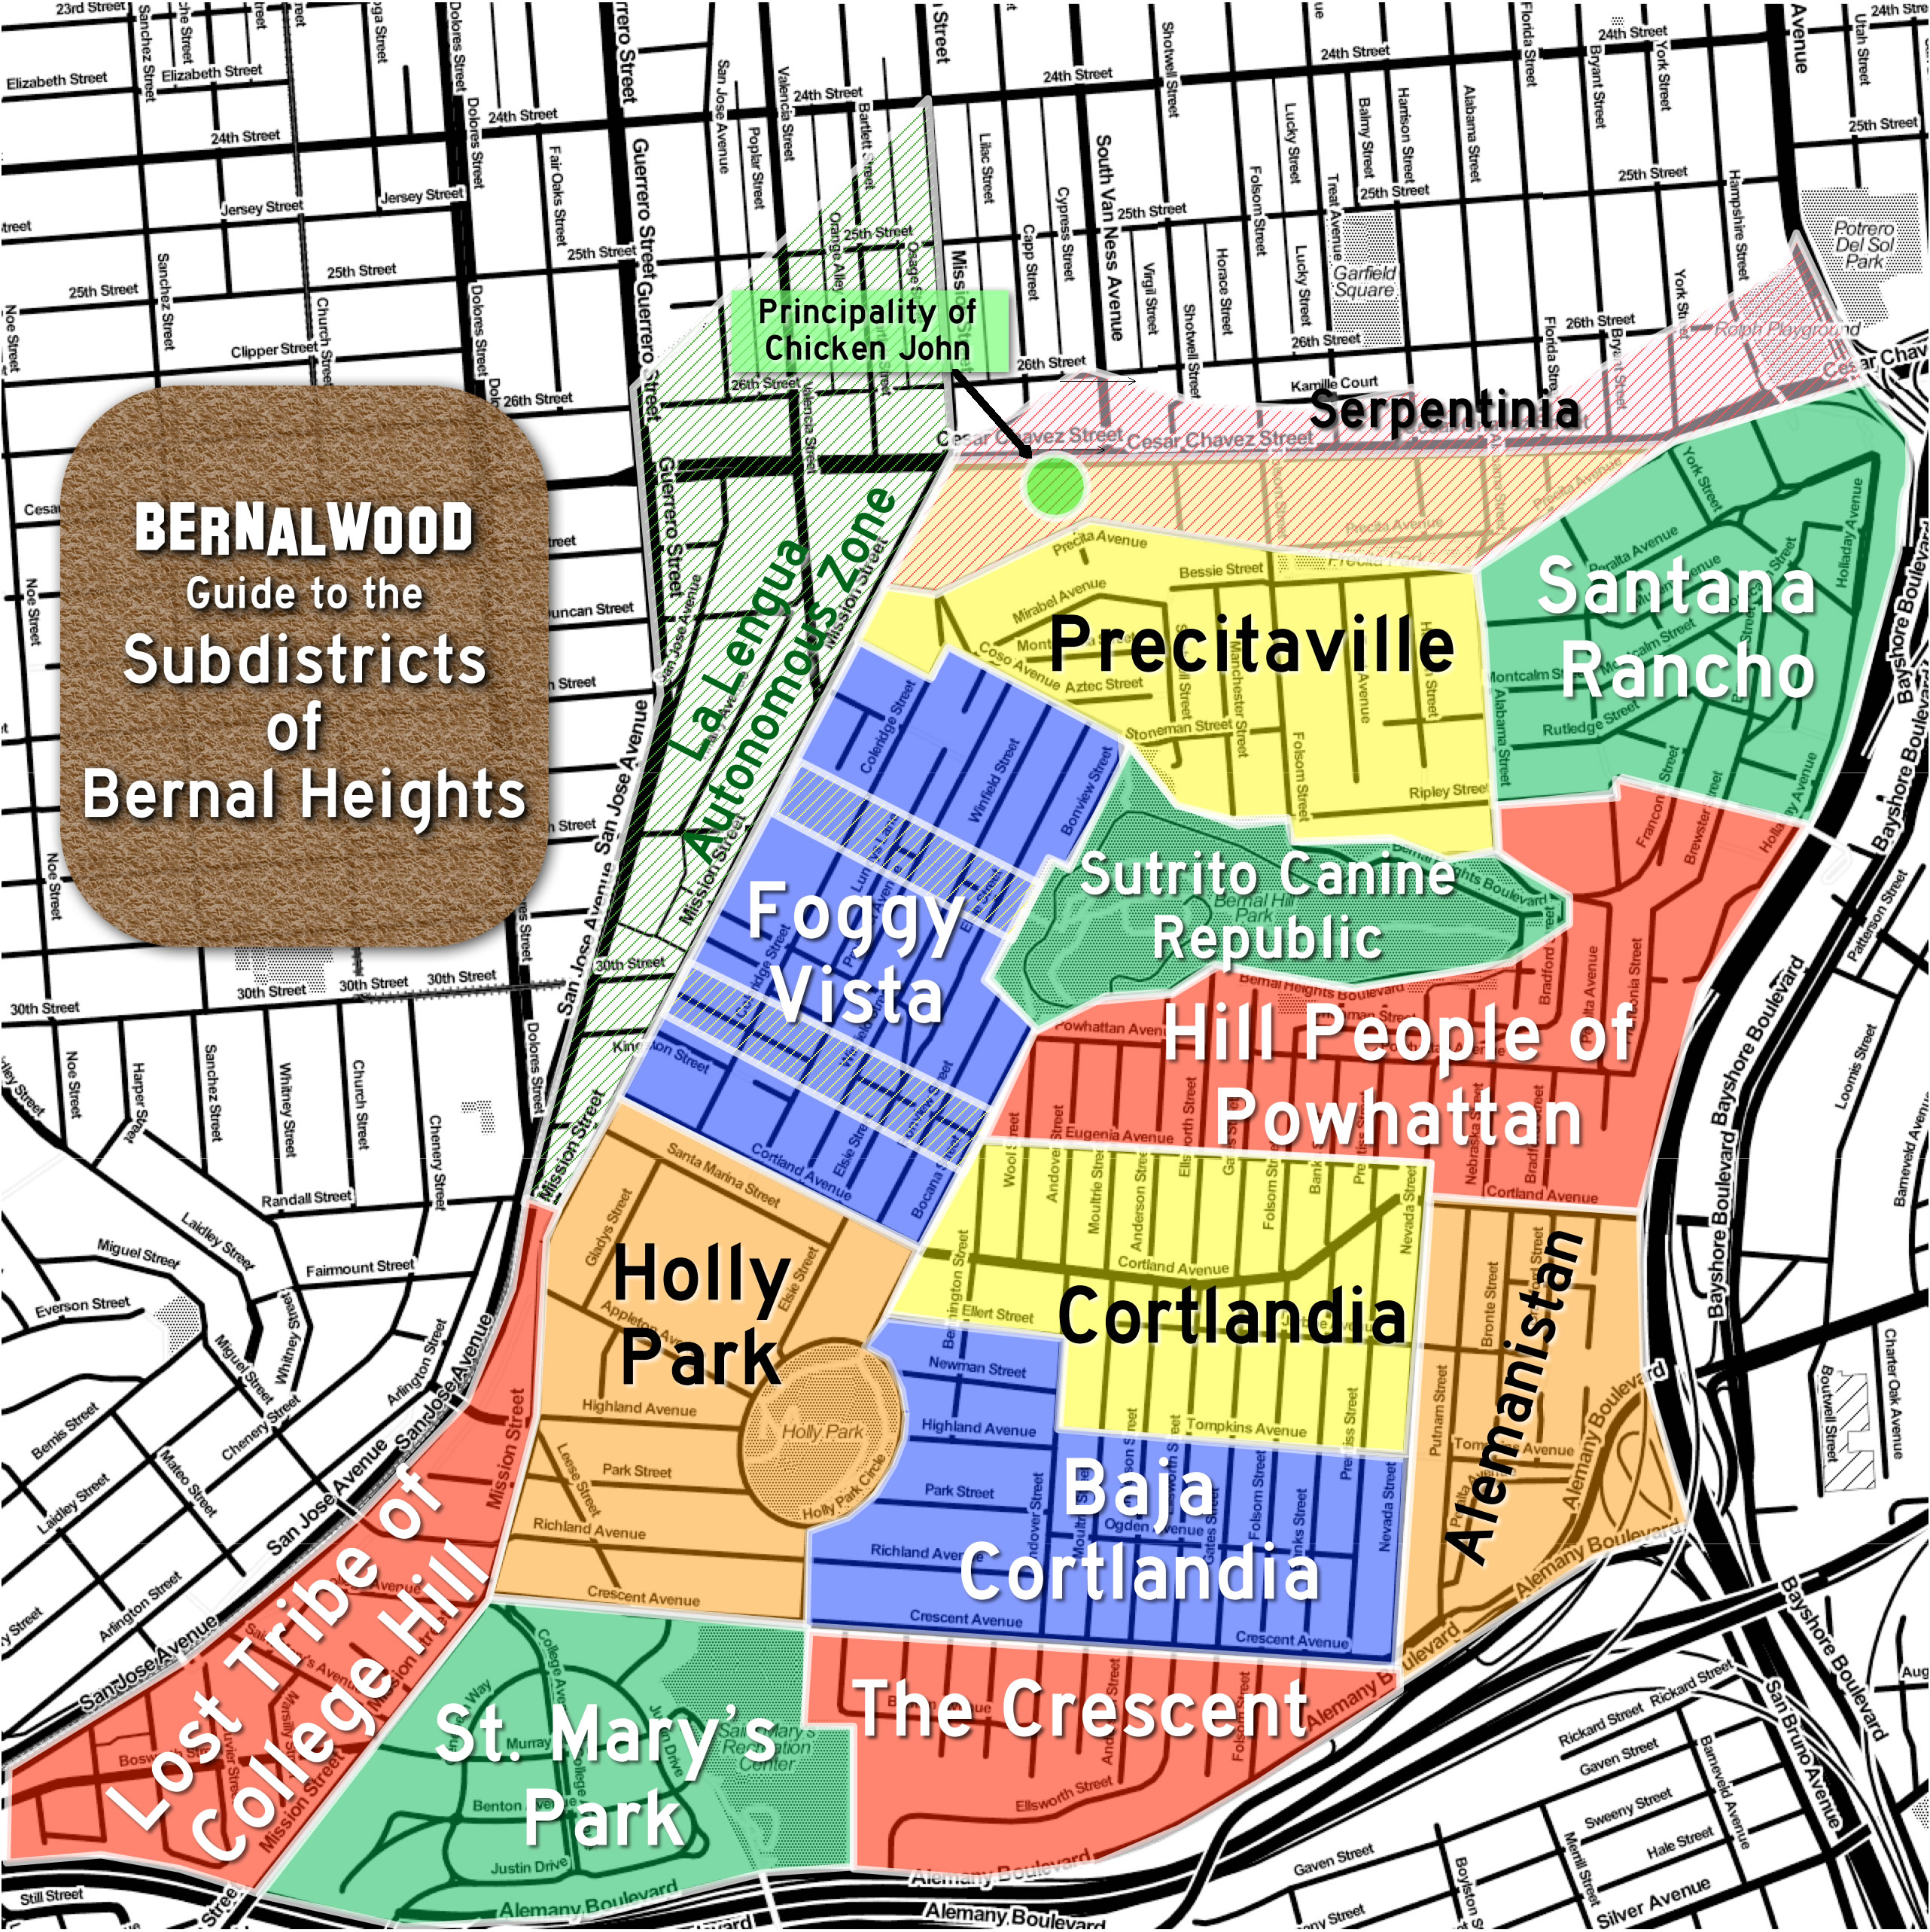
As you no doubt recall, Bernalwood’s 2014 Official Guide to the Subdistricts of Bernal Heights (shown above) was created to map the cultural and topographical geography of our neighborhood in a way that’s both tongue-in-cheek and also kind of somehow vaguely true. What you may not recall, however, is that the Official Subdistricts were specifically created as a playful response to a realtor who had attempted to create her own (less homegrown) sub-map of Bernal Heights.
Well, now that concept has come full-circle.
Neighbors Michael Minson and Danielle Lazier live in Bernal Heights, and they work as realtors. So when Neighbors Michael and Danielle approached Bernalwood seeking permission to use Bernalwood’s Official Subdistrict Map as a framework to analyze 2014 Bernal Heights real estate trends, we had to say yes. Because they are certified Bernalese. Because data. Because economics. Because morbid curiosity.
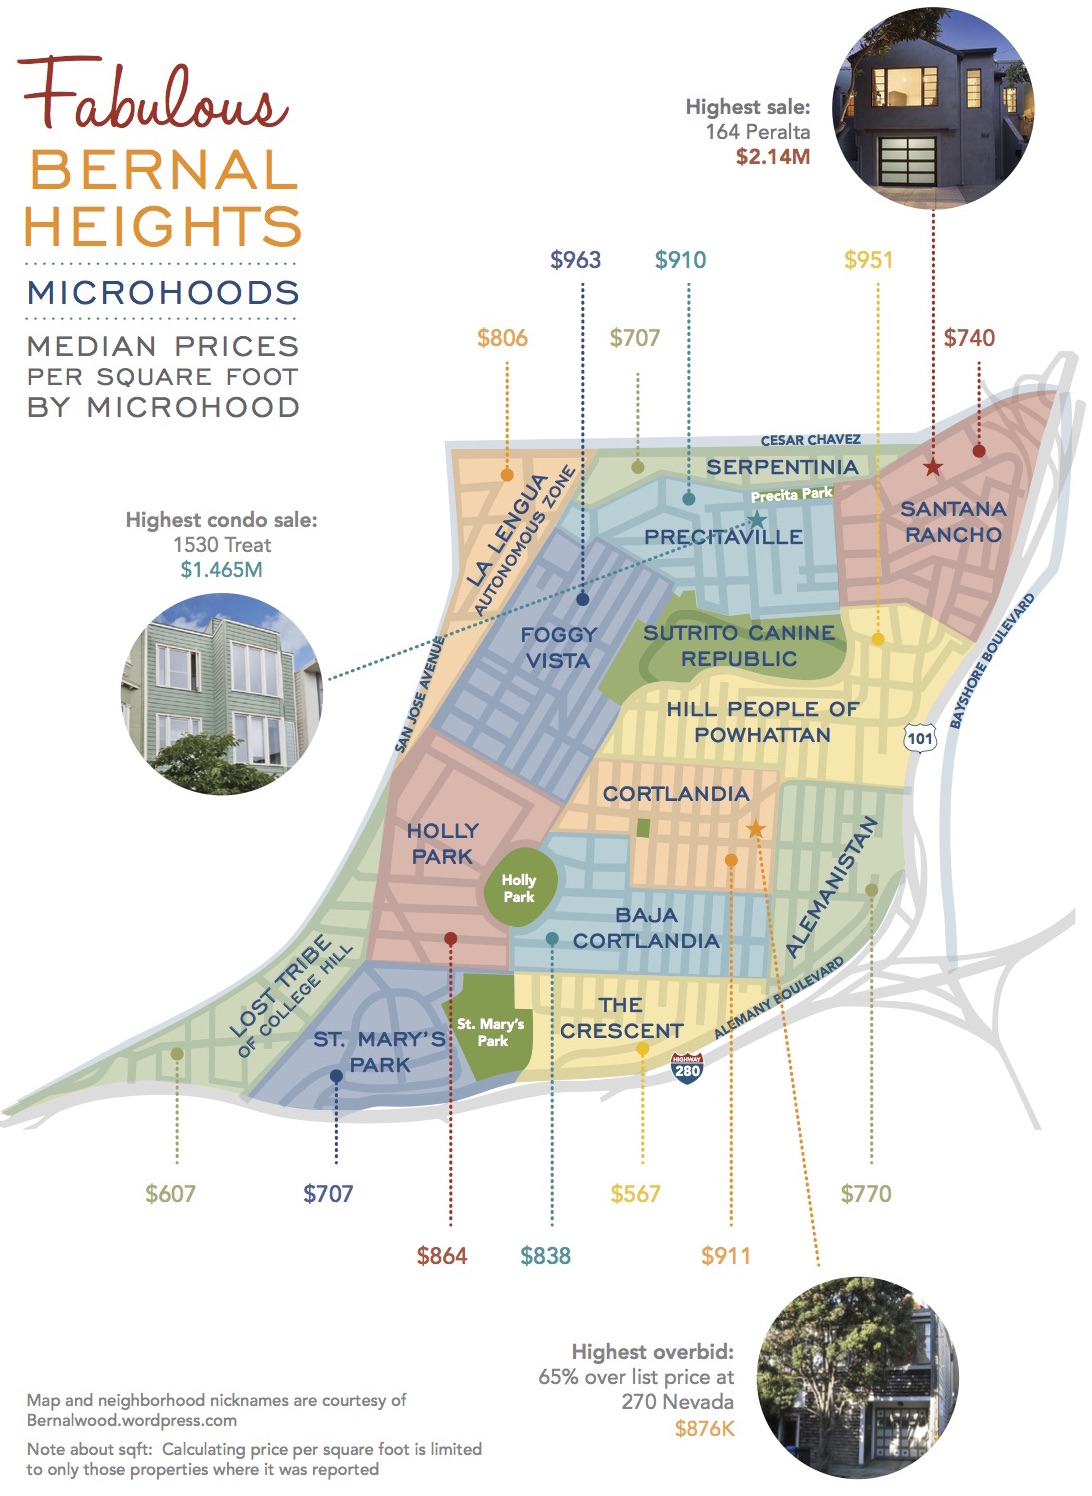
And what are the results? Well, when Neighbors Michael and Danielle mapped 2014 residential sales against the Official Microhoods of Bernal Heights, they got a year-in-review infographic that looks like this:
They also offer this executive summary:
2014 was another banner year of double digit appreciation and record high prices for Bernal Heights. The median increase in sale price for single family houses in Bernal increased 21% from 2014 over 2013.
This followed a 23% median increase from the year prior.
The median sales price for a house was $1.16M this year.Your intrepid real estate agents and data junkies analyzed the Bernal market using the infamous Bernalwood Microhood map as a way to further understand the market. Microhood names and designations are courtesy of our friends at Bernalwood.
Click here for the full Bernal Heights 2014 Market Recap Report. For the hardcore, you can also check out our raw data set.
Outlook–The view from the hill
> Bernal market is very strong–sellers remain in a great position
> As more inventory comes on market, prices are expecting to stabilize
> Expect $900+/sq. ft. or more to become the new median PPSF
> List prices will increase but overbidding will remain prevalentBernal Insights Overall – What did we see?
> Market is still very strong but may be cooling ever so slightly (21% increase in median price vs. 23% last year)
> Less inventory is keeping house prices high–10% fewer houses traded; median price is at an all-time high of $1.16M
> An increase in condo supply in 2014 may be the cause for the relatively more modest 10% median price appreciation in Bernal’s condo market
> Demand is still very high– 83% of houses and 73% of condos sold over asking, with an average of 18% and 11% over list price, respectively
> Median price per square foot for houses is $811/sq. ft., condos is $786/sq. ft.
> Overbidding is the norm: 83% of houses sold over the list price, at an average of 18% over. 73% of condos sold over asking, at an average of 11% over.
Real Estate Graphic: via MichaelMinson.com

We live near Precita park, and years ago (1995) our lovely Italian neighbor (RIP Francesca) told us that technically, to live in “Bernal Heights”, one had to live SOUTH of the hill. Everything on the ‘North Slope’ was part of the Mission. Francesca always referred to living in the Mission.
Yup! I completely agree..
I always consider the ‘border’ to be Cesar Chavez. Not saying I am right or that Francesca is wrong, just saying.
Yes Suckerpunch the border is Cesar Chavez. I grew up in Bernal and in the 60 – 90’s the little lost tribe of college never wanted to be a part of Bernal Heights.
Thanks Todd. It was super fun (and very interesting) to make!
I guess we are “Hill People”.
Sent from my iPhone
>
One month into 2015 and already a new record price for a Bernal home:
http://www.socketsite.com/archives/2015/02/record-setting-bernal-heights-home-doesnt-parking-spot.html#comments
It would be very interesting to see the change in race/ethnicity demographics from 2009 to 2014 in Bernal microhoods.
Will you feel guilt if it shows european descendants have grown as a percentage and hispanics have decreased?
How do you feel about many South Bay affluent neighborhoods becoming mostly inhabited by people from east asia? Will you have a parade to save the white people?
PS I’m not really that angry. I’m just making a snarky comment on a blog.
Sorry but I’m not white. I also try not to contribute assholery in this world since there’s already such great abundance.
I was thinking about the data and how it pertains to the white privilege and cultural arrogance and the killing of people of color by police.
“Market is still very strong but may be cooling ever so slightly (21% increase in median price vs. 23% last year)”
LOL. The notion that a 20% annual increase is any kind of cooling—ever so slight or otherwise—tickles my funny bone.
I stand by my assertion that folks up and along Coso/Stoneman are not part of your lowland Precitaville!
@Brandon — Totally agree with your last statement and think Precitaville should end at Folsom. The area bound by Coso/Stoneman/Folsom/Precita is ripe for its own microname.
There’s no major connecting street to Precitavile (Precita is a one one flowing away from the park at that point), and the views of downtown from the Mirabel steps (and surrounding homes) are unique to that chunk of hill.
woo! keepin it real in The Crescent. A bit too real sometimes. 😦
That delineation is silly. My house in on the south side of Crescent, while a house 1/2 block away on the north side that sold for $1.4 million is counted as part of south Cortland.
This word, “raw data”, I do not think it means what you think it means. And I say that as a professional data scientist.
Yeah, I know what you’re saying, Matt. The link leads you to aggregated data. Here’s the true raw data. It’s not very pretty, but for the sake of transparency here you go: https://docs.google.com/a/michaelminson.com/spreadsheets/d/12oWqwUbPiLgx7FgGFxD4UvizUE9JWSQpjsE15PZqH8U/edit#gid=1418844449
– Michael (not a data scientist)
How is Rolph Playground in Bernal? This is like Crimea what is happening here.
Ackkk, enough with the real estate, border, and demographic chatter! Where’s my Bernal Microhood tee shirt?
It was left on your porch. Did you not get it?
Pingback: Infographic Reveals Bonkers First-Half 2015 Bernal Heights Microhood Real Estate Trends | Bernalwood
Pingback: Bernal Real Estate Market Less Bonkers, More Balanced in 2015 Microhood Report | Bernalwood